
Roofing Data Analytics: A 2026 Guide for Executives
Unlock profit potential with roofing data analytics in 2026. Discover key metrics and tools that enhance efficiency and decision-making.

Roofing data analytics is the structured collection and analysis of operational, financial, and project data to improve profitability and decision-making in commercial roofing. Firms that master this discipline track labor productivity, material cost variance, and service contract attach rates as core performance indicators. Tools like AI-driven aerial imagery platforms, project management systems, and real-time labor tracking software provide the raw data. The gap between top-tier operators and the industry median is not a mystery. It is a measurement problem. Executives who close that gap do it with better data, not harder work.
What Roofing Data Analytics Metrics Drive Efficiency And Profit?
The most critical roofing performance metrics for commercial contractors fall into three categories: labor efficiency, cost control, and revenue quality. Tracking all three simultaneously gives executives a complete picture of where margin is being made or lost.
Labor Productivity
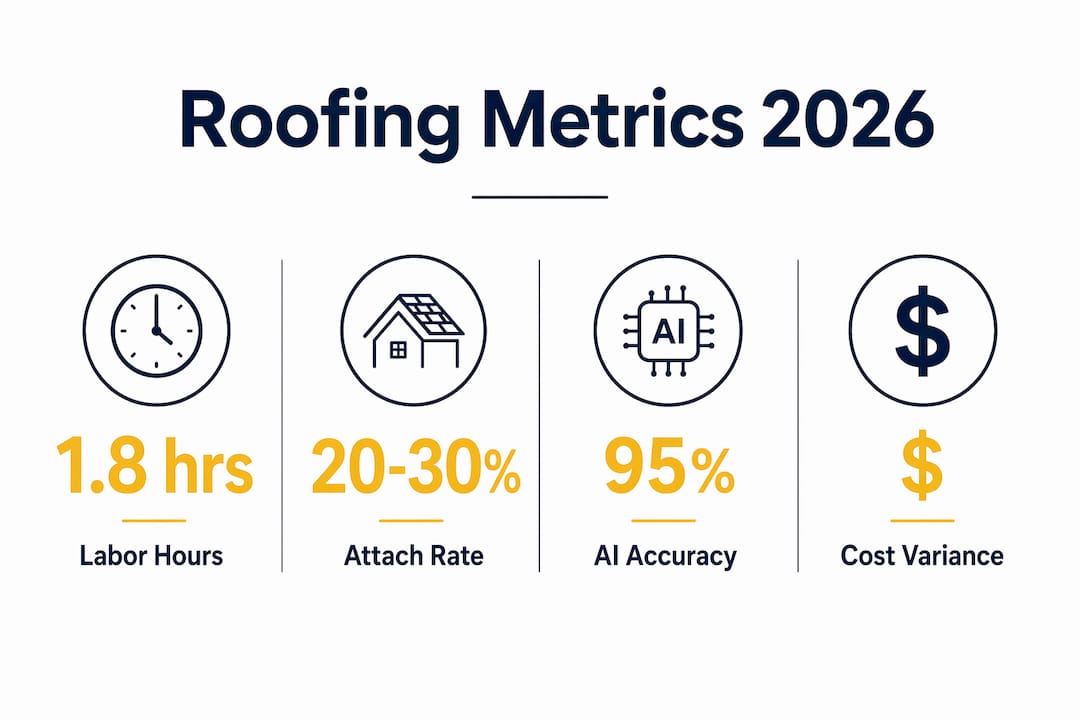
Labor is the largest variable cost on any commercial roofing project. Top-tier firms average 1.8 labor hours per square versus the industry median of 2.4 hours. That gap translates to $375–$525 in daily labor savings per crew. Firms that track this metric at the crew-task level, not just the job level, find the specific bottlenecks that aggregate data hides.
Labor Cost Variance
Labor cost variance measures the difference between budgeted and actual labor spend on each job. Tracking variance at the crew-task level reveals sub-task inefficiencies, such as sheathing prep delays, that can consume 15% or more of total labor hours. Catching these patterns early prevents them from compounding across a full project portfolio.
Material Cost Tracking and Job Completion Rate
Material cost tracking compares estimated versus actual spend on every line item. Job completion rate measures the percentage of projects finished on schedule. Both metrics feed directly into gross margin forecasting. Firms with strong data discipline on these two indicators report 32% higher profit margins and 60% fewer callbacks than industry medians.
Service Contract Attach Rate
The service contract attach rate measures how often new installation customers convert to ongoing maintenance agreements. The industry median sits at 20–30%. Healthy commercial operations maintain a 55–75% attach rate, and firms that hit this range command significantly higher valuation multiples at exit.
Pro Tip: Track labor variance at the crew-task level, not just the job level. Aggregated job data masks the specific tasks, like tear-off or flashing installation, where your crews consistently run over budget. Fix the task, and the job numbers follow.
How Do AI And Predictive Analytics Transform Roof Condition Assessment?
AI-driven analytics is the most significant shift in commercial roofing data in the past five years. The technology moves condition assessment from a manual, inspection-dependent process to a continuous, data-enriched workflow.
AI models analyzing aerial and historical imagery achieve 95% accuracy in detecting roof age and condition. Moody’s CAPE Roof Age Solution is one example of this capability applied at scale for insurance underwriting. The same data layer that insurers use to price risk can inform your maintenance planning and capital expenditure forecasts.
The practical impact is significant. Predictive modeling built on this data reduces emergency callouts by up to 40%. That reduction matters because emergency service calls carry the highest labor cost per square and the lowest customer satisfaction scores. Shifting from reactive to proactive maintenance is not just a cost play. It is a customer retention strategy.
Integrating AI-based condition data into your workflows produces three specific advantages:
- Replacement timing accuracy: Identify which roofs in your service portfolio are within 18–24 months of failure before the customer calls you.
- Insurance and risk alignment: Use condition scores to support warranty claims and insurance documentation, reducing dispute resolution time.
- Capital planning support: Give property managers multi-year budget projections backed by objective data, not visual estimates from a single site visit.
The prerequisite for all of this is clean historical data. Descriptive analytics mastery precedes effective AI predictive modeling. Firms that skip foundational metrics and jump straight to AI tools end up with unreliable forecasts built on flawed inputs.
What Are The Best Practices For Integrating Analytics Into Roofing Workflows?
Data integration in commercial roofing fails most often for two reasons: dirty data and cultural resistance. Both are solvable, but they require different interventions.
Start with data cleanliness
Analytics projects fail when CRM and job cost records contain inconsistent data. Discrepant naming conventions for materials and labor categories prevent AI tools from synthesizing records accurately. Before deploying any analytics solution, standardize how your team names every labor task and material line item across all projects. This is unglamorous work, but it is the foundation everything else depends on.
Build a data-sharing culture
Digital transformation in roofing is a cultural challenge more than a technical one. Contractors who share performance data openly with crews see higher productivity and engagement. Linking crew-level metrics to compensation or bonuses creates a direct incentive for field teams to care about data accuracy. When crews understand that their labor hours feed into a system that rewards efficiency, adoption follows. For practical guidance on building this culture, the crew technology adoption process matters as much as the platform you choose.
Choose tools that prioritize time-to-insight
The comparison below shows common data sources and the integration touchpoints that matter most for commercial roofing executives.
Top operators use modular analytics tools that deliver profit-slippage alerts before a project closes, not after. Platforms that require weeks of configuration before producing a single usable report slow down the decision cycle. Prioritize solutions that connect to your existing workflows and surface alerts in near real time.
Pro Tip: Avoid analytics platforms that require you to export data into a separate reporting tool. Every manual export step is a point where data gets stale or skipped. The best construction data insights come from systems where data flows automatically from field capture to executive dashboard.
How Can Analytics Help Executives Manage Revenue Mix And Long-Term Stability?
Revenue mix management is one of the most underused applications of commercial roofing data. Most executives track total revenue. The best ones track where that revenue comes from and what it signals about business risk.
Storm-restoration revenue should stay below 25% of total revenue to avoid dangerous dependency on weather events. Firms that exceed this threshold face volatile cash flow, unpredictable crew utilization, and lower valuation multiples when they go to market. Data analytics makes this risk visible before it becomes a crisis.
The key KPIs for revenue mix management in 2026 are:
- Storm-restoration revenue percentage: Target below 25% of total. Monitor quarterly.
- Service contract attach rate: Target 55–75%. Track by sales rep and project type.
- Bid-hit ratio: Measures sales efficiency. Low ratios signal pricing or proposal quality issues.
- Backlog value: The total contracted revenue not yet earned. A leading indicator of crew utilization and cash flow.
- Win rate by project type: Separates performance on new construction, re-roofing, and maintenance bids.
The table below summarizes benchmark targets relevant to commercial roofing executives for 2026.
The attach rate metric carries outsized importance for firm valuation. Companies below the 20–30% median range sell at 3–4x asset value. Companies in the 55–75% range command 8–12x EBITDA multiples. That difference is not driven by revenue size. It is driven by revenue predictability, and predictability is a data problem. Tracking sales pipeline metrics like backlog and win rates gives executives the leading indicators they need to manage this proactively.
Key Takeaways
Commercial roofing firms that master data analytics at the labor, cost, and revenue level consistently outperform competitors on both margin and valuation.
How Terial Turns Your Operational Data Into Decisions
Fragmented tools are the primary reason commercial roofing firms cannot act on their data. When labor hours live in one spreadsheet, job costs in another, and invoices in a third system, no executive has a real-time view of profitability. Terial solves this by connecting estimating, field labor tracking, project scheduling, and invoicing into one real-time system built specifically for commercial roofing contractors. Crew performance dashboards surface labor variance the moment it appears. Automated reporting eliminates the manual export cycle that delays decisions. Explore Terial’s full platform features to see how unified data turns field activity into the financial clarity your operation needs.
FAQ
What is Roofing Data Analytics?
Roofing data analytics is the structured collection and analysis of labor, cost, and project data to improve profitability and decision-making in commercial roofing operations. It covers descriptive metrics like job cost variance and predictive tools like AI-driven roof condition assessment.
Which Roofing Performance Metrics Matter Most for Profitability?
Labor hours per square, labor cost variance, service contract attach rate, and job completion rate are the four metrics with the strongest direct link to gross margin and firm valuation. Top firms track these at the crew-task level, not just the job level.
How Accurate is AI for Roof Condition Assessment?
AI models analyzing aerial and historical imagery achieve 95% accuracy in detecting roof age and condition. This level of accuracy supports proactive maintenance planning and reduces emergency callouts by up to 40%.
How Do I Start Integrating Data Analytics into My Roofing Workflows?
Start by standardizing naming conventions for all labor tasks and material line items in your existing systems. Clean, consistent historical data is the prerequisite for any predictive analytics tool to produce reliable results.
What Service Contract Attach Rate Should Commercial Roofers Target?
The industry median attach rate is 20–30%, but top-performing firms maintain 55–75%. Firms in the higher range sell at 8–12x EBITDA multiples versus 3–4x asset value for firms below the median.
Recommended




Book a personalized demo
Get a 30-minute demo tailored to how you run your commercial roofing business

“Making the switch to Terial has greatly exceeded my expectations and has already had a meaningful impact on our team’s productivity. Terial has significantly reduced the amount of time required to complete many of our day-to-day operational tasks, allowing our team to focus more on serving our customers.”

