
Track Technician Productivity in Your Roofing Service
Learn to track technician productivity in your roofing service effectively. Measure key metrics and enhance crew efficiency today!

Start measuring today with three numbers: squares per man-hour, revenue per installer, and GPS-verified labor hours. Run a pilot with one crew for a few weeks before touching anything else.
Here is what to do in the next 24 hours:
- Enable foreman-led crew clock-in with geofencing. One tap clocks the whole crew and ties every hour to the correct job site automatically.
- Require end-of-day squares-installed input. Foremen log total squares completed before they leave the site. That single number, divided by total man-hours, gives you your first real productivity signal.
- Set a daily foreman checkpoint. Five minutes at end-of-day to flag any deviation from the estimate. If the crew installed 8 squares against a 12-square day plan, you know before the job bleeds.
These three actions work together because they capture output (squares), dollar impact (revenue per installer), and verified time (GPS clock-in) simultaneously. You get a complete picture without building a reporting department.
Pro Tip: Don’t try to instrument every crew at once. Pick your most reliable foreman, run the pilot for a few weeks, and fix the workflow gaps before you scale. Rushing rollout is the single fastest way to get bad data.
What Is Technician Productivity, and How Does It Differ From Utilization?
These two terms get used interchangeably, and that confusion costs operations leaders real money.
Utilization measures the percentage of clocked hours a technician spends on work, as opposed to travel, breaks, or idle time. A crew clocked in for eight hours that spends six hours on the roof has 75% utilization. That is a useful number, but it tells you nothing about how much they actually got done.
Productivity measures verified output per labor hour. For roofing, that means squares installed per man-hour, adjusted for job complexity. A crew can have high utilization and low productivity if they are working slowly, dealing with poor staging, or fighting a dumpster that is in the wrong spot.
Standard definitions frame productivity as actual time worked divided by available clock hours, but roofing requires a layer on top of that: weather stops, multi-site days, roof pitch, and complexity all change what a “good” output number looks like. A 4/12 pitch and a 10/12 pitch are not the same job, and treating them identically in your metrics will mislead you every time.
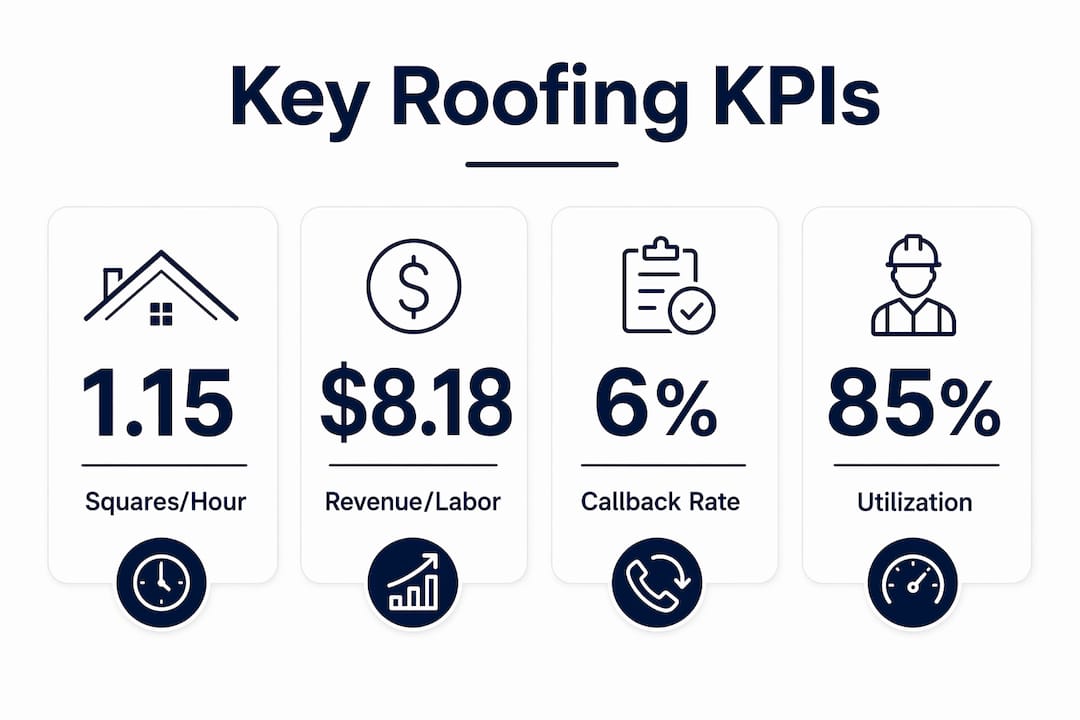
The practical takeaway: track utilization to catch scheduling and routing waste, but manage the business on productivity. Utilization tells you where the time went; productivity tells you what you got for it.
Pro Tip: Foreman-led crew clock-in dramatically reduces friction and improves data quality. When one person clocks the whole crew with a single tap, you get consistent site attribution and far fewer missed punches than individual self-reporting.
Key Metrics to Track for Roofing Technician Productivity
The KPIs that matter for field technicians map directly to business outcomes: output, revenue, quality, and time. Here are the ones worth tracking, with formulas you can paste into a spreadsheet today.
Worked Examples
Example 1 — Squares per man-hour: A five-person crew installs 22 squares on a standard commercial low-slope roof over eight hours. Total man-hours = 5 × 8 = 40. Squares per man-hour = 22 ÷ 40 = 0.55. That is well below the benchmark range of 1–1.25 squares per man-hour for experienced crews; falling below 0.8 should trigger an operational review. Such a low number points to a systemic problem: staging, routing, or tool availability, not crew effort.
Example 2 — Revenue per installer: A crew of four completes a $48,000 commercial job. Revenue per installer = $48,000 ÷ 4 = $12,000 per installer for that job. Top operators typically see high revenue per installer when annualized across a full book of work. If your number sits well below that range, you have either a pricing problem or a productivity problem, and the other metrics will tell you which.
Example 3 — Callback rate: A crew completes 40 jobs in a quarter and gets called back on 6. This callback rate represents a quality signal that should trigger a workmanship review before you tie any bonus to square counts.
What “Good” Looks Like for Commercial Roofing
Experienced crews on standard commercial roofs achieve 1–1.25 squares per man-hour. Falling below 0.8 consistently signals operational leakage, not a bad crew. For capacity planning, target 70–80% of theoretical maximum output to build in buffer for weather delays, complex valley work, and equipment issues.
How Do You Measure These KPIs Reliably in the Field?
The data problem in roofing is not a lack of information. It is that the information lives in three different places: a foreman’s memory, a paper timecard, and a payroll spreadsheet that nobody reconciles until Friday.
Primary Data Sources
- GPS-verified time tracking: Geofenced clock-in ties hours to a specific job address. Continuous or breadcrumb GPS confirms the crew was on site, not parked down the street.
- Foreman end-of-day output reports: Squares installed, phase completed, and any weather or equipment delays. This takes under three minutes and is the single highest-value data input you can collect.
- Digital job forms and photo capture: Time-stamped photos of completed phases serve as both quality evidence and productivity verification. A photo of a finished tear-off with a timestamp is better than any manual log.
- Equipment and dumpster logs: Dumpster swap times and equipment delivery windows reveal non-crew bottlenecks that show up as lost productivity.
- Payroll and timecard exports: These reconcile against GPS data to catch missed punches and overtime patterns.
Tool Features That Actually Matter
Roofing time-tracking software needs to do more than log hours. The features that matter for accurate job costing on multi-job days are GPS geofencing and per-job cost codes, offline queueing for low-signal sites, photo-stamped evidence, manager approval workflows, and payroll exports that handle FLSA overtime correctly.
A practical instrumentation checklist covers five dimensions: Who (identity verification), Where (GPS per punch), When (timestamped starts, stops, and weather breaks), What (cost code), and Job (address tied to the estimate).
Implementation Steps for One Crew
- Pick one foreman and crew for the pilot.
- Enable geofencing for their primary job sites and configure per-job cost codes.
- Train the foreman on end-of-day squares reporting (five minutes, one screen).
- Require photo evidence at the end of each major phase (tear-off complete, deck inspection, install complete).
- Run a daily five-minute review of GPS hours versus reported squares for the first two weeks.
- Identify the top two data gaps (missed punches, wrong cost codes) and fix the workflow before adding a second crew.
Pro Tip: Test geofencing and cost-code workflows with one crew for two to four weeks before company-wide rollout. Geofence radius, offline sync timing, and cost-code structure all need tuning to your specific job types. Skipping this step means bad data at scale.
Tactics That Move the Needle on Roofing Productivity
Most productivity losses in commercial roofing come from systemic friction, not crew effort. Routing gaps, dumpster placement, and staging delays routinely cost more than a slow installer. Fix the system first.
Quick Wins for the First Week
- Enforce end-of-day squares reporting for every active crew, even before you have a formal tracking tool in place.
- Tighten routing for multi-job days: group jobs by geographic proximity and cut transit time below 15% of total clocked hours.
- Standardize crew sizes by job type so output is comparable across crews. A four-person crew and a six-person crew on the same job type produce different numbers for reasons that have nothing to do with performance.
- Add weather-delay cost codes immediately. Without them, weather hours inflate your labor cost and suppress your productivity numbers, making good crews look bad.
Mid-Term Levers (Weeks 2–12)
Debris management is one of the most underrated productivity drivers in commercial roofing. A dumpster in the wrong position can add significant minutes of carry time per crew per day. Standardize dumpster sizing and placement as part of your pre-job checklist.
Equipment investments pay off faster than most owners expect. A nail gun trailer staged correctly at the start of the day eliminates multiple trips and keeps the crew on the roof. Pair equipment upgrades with a standardized work breakdown structure that breaks each job into measurable phases: tear-off, deck inspection, underlayment, install, and cleanup. When you can see which phase is running long, you know exactly where to intervene.
Foreman training on installation standardization matters more than most operations leaders realize. Foremen who understand the bid estimate and can compare real-time output to it catch variances before they compound. That is the core of what gets measured getting done: equip foremen with the data, and they manage to it.
Long-Term Systems (Quarterly and Beyond)
Incentive design tied to output-per-labor-dollar, with quality and callback guardrails, is the most durable productivity lever available. Reward revenue-per-installer and quality simultaneously. A crew that hits high square counts but generates callbacks is not a high-performing crew; they are a liability. Combining both metrics in a bonus structure eliminates the gaming problem.
Capacity planning should target a fraction of theoretical maximum output to absorb weather delays, complex valley work, and equipment failures without blowing the schedule. Crews running at 100% capacity consistently make more mistakes and generate more callbacks.
Pro Tip: Combining qualitative and quantitative metrics prevents bad incentives. A foreman who knows their bonus depends on both squares installed and callback rate will not sacrifice quality to hit a number.
How to Run a Pilot, Set Benchmarks, and Roll Out at Scale
A structured pilot protects you from two failure modes: rolling out bad data at scale, and abandoning measurement because the first week looked messy.
Days 1–30: Pilot Phase
- Configure geofencing and cost codes for one crew’s active job sites.
- Assign one foreman as the pilot lead and brief them on the daily reporting expectation.
- Collect daily squares installed and GPS-verified hours. Do not adjust or clean the data yet; just collect it.
- Run a five-minute daily review and a 30-minute weekly deep review with the foreman.
- Note every data gap (missed punches, wrong cost codes, weather not coded) and fix the workflow, not the data.
Days 31–60: Diagnose Phase
Segment the pilot jobs by complexity. A flat TPO membrane job and a steep metal panel job are not comparable without a multiplier. Apply a 1.0 multiplier for standard complexity and 1.5 for steep or complex work, then recalculate squares per man-hour across the adjusted dataset.
Identify the top three bottlenecks. In most commercial operations, they cluster around routing (transit time above 20% of clocked hours), debris management (dumpster delays), and tool availability (waiting for equipment). Run one remediation experiment per bottleneck and measure the before-and-after output.
Days 61–90: Rollout Phase
Scale the instrumented workflows to all crews. Publish daily scoreboards so foremen know by midday whether they are ahead or behind the estimate. Set standardized crew sizes by job type. Link commissioning bonuses or coaching conversations to metric thresholds, not to subjective performance reviews.
Sample Benchmarks to Watch
- Squares per man-hour: Target 1.0–1.25 on standard complexity; flag anything below 0.8 for review.
- Transit time: Keep it below 15% of total clocked hours for urban markets; below 20% for rural.
- Callback rate: Flag crews above 10% for workmanship review.
- Billable hours: Target above 85% of total clocked hours.
For pre-season crew readiness and operational planning, seasonal preparation guides offer practical benchmarks for crew capacity and scheduling before high-volume periods.
The objective is to give foremen a scoreboard, not a camera. When foremen can see their output against the bid estimate in real time, they manage to it. The data is for them as much as it is for you.
The Output Per Labor Dollar Model: A Roofing-Specific Productivity Framework
Squares per man-hour tells you how fast a crew works. Output Per Labor Dollar tells you how profitably they work. These are different questions, and the second one is the one that shows up in your margin.
Formula: Output Per Labor Dollar = Job Revenue ÷ Total Labor Cost on Job
Worked Example
A commercial crew completes a $72,000 flat-roof TPO job. The crew of five works 160 total hours at an average fully-loaded cost of $55 per hour. Total labor cost = 160 × $55 = $8,800.
Output Per Labor Dollar = $72,000 ÷ $8,800 = $8.18 per labor dollar.
Now run the same calculation on a job where the crew took 220 hours due to staging delays and two callback visits. Total labor cost = 220 × $55 = $12,100. Output Per Labor Dollar = $72,000 ÷ $12,100 = $5.95 per labor dollar. Same revenue, same crew, 27% lower return on labor. That gap is the cost of operational friction.
Sample Daily Dashboard Structure
Using Complexity Multipliers
Apply a 1.0 multiplier for standard flat or low-slope commercial work. Use 1.5 for steep-slope or complex configurations. When comparing crews or jobs, always normalize to the adjusted squares-per-man-hour figure. A crew hitting 0.9 adjusted squares per man-hour on a 1.5-complexity job is outperforming a crew hitting 1.1 on a 1.0-complexity job.
For a closer look at how real-time labor tracking feeds this model in practice, the connection between GPS-verified hours and job-cost accuracy is direct: bad time data produces bad Output Per Labor Dollar numbers, and you end up optimizing a fiction.
Pro Tip: Use Output Per Labor Dollar alongside revenue-per-installer. The first identifies high-margin jobs and crews; the second identifies high-revenue producers. A crew that scores well on both is your benchmark. A crew that scores high on one and low on the other needs a different kind of attention.
Terial Puts Your Productivity Data in One Place
Disconnected tools are the real productivity problem. When GPS hours live in one app, squares get logged in a text message, and job costs sit in a spreadsheet nobody updates until billing, you are not measuring productivity. You are reconstructing it after the fact, and the reconstruction is always wrong.
Terial is built specifically for commercial roofing operations. Its field service application handles geofenced crew clock-in, per-job cost codes, photo-stamped phase completion, and manager approval workflows in a single mobile interface that foremen actually use. Labor hours feed directly into job-cost monitoring, so your Output Per Labor Dollar calculation updates in real time, not at month-end. Automated daily scoreboards give foremen the variance data they need to manage against the estimate without a phone call to the office.
The result: faster diagnosis of overruns, cleaner payroll, better bid accuracy on future jobs, and foreman scoreboards that reflect reality. See how Terial’s workflow automation fits your operation and request a demo.
Key Takeaways
Tracking technician productivity in commercial roofing requires three core inputs: squares per man-hour (complexity-adjusted), revenue per installer, and GPS-verified labor hours, all validated through a 2–4 week single-crew pilot before company-wide rollout.
Useful Sources and Further Reading
- Measuring Technician Performance (WANADA) — Foundational definition of productivity vs. utilization for field technicians; useful for calibrating your baseline metrics.
- What Gets Measured Gets Done (Professional Roofing) — Argues for accountability-to-numbers over surveillance; explains how foremen use real-time variance data against estimates.
- Time Tracking for Roofing Contractors: A Field Guide (Klees) — Practical guide to geofencing, foreman-led clock-in, and the 2–4 week pilot approach.
- The Best KPIs for Roofing Contractors (PulseRevOps) — Benchmark data for squares per man-hour and operational leakage thresholds; primary source for the 1–1.25 range.
- Maximize Profits: Review 10 Roofing KPIs Weekly (RoofPredict) — Revenue-per-installer benchmarks ($230k–$300k for top operators) and the case for treating labor as a revenue asset.
- How to Track Hours for a Roofing Crew (Punch) — Covers the Who/Where/When/What/Job instrumentation checklist and geofencing requirements for multi-job days.
- 7 Best Roofing Time Tracking Software (Roofers Guild) — Feature comparison of time-tracking tools; useful for evaluating GPS, offline mode, and payroll integration requirements.
- KPI for Technician (BuildOps) — Definitions and business-outcome mapping for first-time-fix rate, billable hours, and utilization.
- Roofing Crew Productivity Benchmarks (Clarity Ops Engine) — Practical benchmarks and capacity planning guidance, including the 70–80% theoretical maximum recommendation.
FAQ
What Is the Best Way to Measure Roofing Technician Productivity?
The most useful starting metrics are squares installed per man-hour, revenue per installer, and GPS-verified labor hours. Together, they show how much work a crew completes, the revenue generated, and how much verified labor time it took.
What Is the Difference Between Technician Productivity and Utilization?
Utilization measures how much of a technician’s clocked time is spent actively working, while productivity measures the output produced during those hours. A crew can have high utilization but low productivity if staging, routing, equipment, or other operational issues slow the work down.
How Can Roofing Contractors Track Labor Hours Accurately?
Contractors can use geofenced clock-ins tied to specific job sites, supported by per-job cost codes and foreman-led crew time entry. GPS verification helps ensure labor hours are attributed to the correct project and improves the accuracy of job costing.
What Is Output Per Labor Dollar in Roofing?
Output Per Labor Dollar measures how much job revenue is generated for every dollar spent on labor. It is calculated by dividing job revenue by total labor cost and helps contractors understand crew profitability rather than measuring speed alone.
Recommended




Book a personalized demo
Get a 30-minute demo tailored to how you run your commercial roofing business

“Making the switch to Terial has greatly exceeded my expectations and has already had a meaningful impact on our team’s productivity. Terial has significantly reduced the amount of time required to complete many of our day-to-day operational tasks, allowing our team to focus more on serving our customers.”

